
Category: Hot Topics
Council Post: What Does The Next Generation Of Smart Cities Look Like?

Smart cities are an emerging solution to the question at the heart of converging trends in rapid urbanization and technological advances: How do we build a world ready for the future, today?
According to the United Nations, 68% of the world’s population is expected to live in cities by 2050. The UN also says sustainable urbanization is the key to successful development. Cities and countries around the world will, in the years ahead, face serious challenges in meeting the needs of their growing urban populations. As our cities grow and expand, we must improve our collective offerings in housing, transportation, energy systems and infrastructure. We must find new avenues for employment and the provision of education and health care. In preparing our world for the next generation of growth and advancement, the technologies powering the smart city movement are set to play a vital role.
Most people, when they think of smart cities, probably think of science fiction; Big Brother’s telescreens in George Orwell’s 1984, or retinal scanners in convenience stores a la Demolition Man. But the reality of the smart city in the real world is far more benign, with an emphasis on technologies that power the infrastructure of the city itself. Even today, smart infrastructure controls our power grids, our water flows and our traffic patterns.
However, somewhere soon, the smart city as we know it today will begin to take siloed systems and connect them, integrating infrastructure around us with our devices, our online data and ultimately our lives. Even at home, smart devices controlled through the internet of things (IoT) are beginning to integrate into single points of control. Imagine that at the infrastructural level.
Although centralized and multifaceted connections controlled at single points of contact may be rare today, smart cities powered by interconnected IoT are the vision of the near future.
Devices connected to the IoT can autonomously perform pre-set actions and can adjust on the fly based on real-world conditions. With smart lighting, for example, failures are automatically reported to the system, and energy production can be more closely dependent on consumption in real-time. Moreover, in our homes and offices, lights left on can automatically dim when ambient lighting is bright enough — to reduce the use of unneeded electricity.
Cities can become smarter, too, with garbage cans that alert waste management when waste-collection is warranted. With more intelligent and efficient routes, garbage collectors can visit only the waste bins that need it.
PROMOTED
Imagine the possibilities that could come with our people-driven and interconnected devices and the self-aware objects around us. Thanks to the ever-expanding communication potential between the two, challenges like finding a parking space may become a worry of the past. Today, certain models of cars can find an open spot using ultrasonic soundwaves and drive you right to that open spot in minutes.
Cities around the world are transforming their digital capabilities to improve the environmental, financial, and social aspects of urban life. However, the changes we’re preparing for today will rely on platforms that connect IoT infrastructure and aid efficiency, help data be shared across systems and further flex IT investments tied to smart missions.
With the right digital platforms, for instance, a city could manage the entirety of its smart city operations from a single portal. It could deploy an army of employees, dispatched each day to perform their jobs by intelligent and informed technologies to drive maximum efficiency. Yet, these capabilities are limited today by a historical approach to data.
Since the advent of the graphic user interface (GUI) over 30 years ago, as made popular by Apple in 1984 and Windows not soon after, computers have remained largely the same, with silos in place between programs and information quarantined within. We have historically put this data in this bucket and that data in that bucket. It’s only today that we’re realizing the need for all our data to live in one great bucket. An interconnected future will require interconnected tools, single-source platforms for management and portability of assets.
Luckily, improvements in the area of flexibility and user-definition of need are on the horizon.
Using machine learning and AI, organizations can begin developing databases that understand the data they contain. They can understand, build and disassemble the relationships within that data in real-time based on need, use and changing requirements.
To be safe and secure, data also needs to understand who owns it, who has access to what parts and what limitations to place on its usage. This functionality allows data access from a multitude of different types of programs — for varying purposes — while reducing the potential for a data breach.
The fundamentals of software development and the concepts of user-interaction must change for end-users to gain the most significant benefit from the aforementioned data model. For our smart cities, our smart homes and our smart devices to connect — for each of us to serve as nodes in a greater digital landscape — we will soon be tasked together to build and adopt platforms for all.
The most powerful thing that you can do to see this bold vision of the future come to bear is simple: Get involved. No one organization can solve a city’s problems. Making our cities better places to live and work requires an ecosystem. If we want to build smarter cities, we need to do it together. By establishing a governance and operations model that includes everyone’s voices through public and private partnerships, we’re far more likely to accelerate adoption and ensure that, when we build systems, we do so with the intention to invest in our future — and in our best potential.
It will require tremendous product architecture to realize the full potential and power of smart data on a mega scale. But in the end, the vision we should all share for ourselves and for our world should encompass not just smart cities, but smart lives.
High Tech arson in California
https://stateofthenation2012.com/?p=130519
New World Order Globalist Cabal Throws
More Fuel On The California Wildfires
![]()
Geoengineered California Firestorms Triggered by Deliberate Acts of Pyro-Terrorism (Videos)
As expected and predicted, the California Fall wildfire season was “exploded” with geoengineering precision and pinpoint arson attacks.
For those uninitiated in the convoluted workings of the complex criminal conspiracy behind these intentional acts of pyro-terrorism, the following exposé provides the necessary background and history.
CA POWER SHUTDOWN: “First they predict the fires, then turn off the power, then start the fires, next they spread the fires….”
Every resident of California ought to be deeply familiar with the well-established dynamic expressed by the preceding post title. Likewise, every person traveling through the now charred Golden State should know exactly where they are going to and staying vis-à-vis the targeted areas that are being burned down on purpose by this state-sponsored criminal conspiracy. Your life may depend on it!
Geoengineered Wildfire Season & Arson Proof
Yes, the once great state of California has always experienced its share of destructive wildfires in the form of forest fires, brush fires and grass fires. However, the last decade has seen a dramatic uptick in both the number and intensity of these devastating conflagrations.
It’s of paramount importance to comprehend that this new trend has been fabricated with highly purposeful design. And, that the real perps — state-sponsored geoengineers and foreign-controlled globalists — are responsible for both covertly creating the conducive conditions for these wildfires, as well as stealthily starting and spreading them via various arson techniques and technologies.
Let’s face it: when headlines like this (see below) now appear regularly — during California’s two wildfire seasons each and every year now — something is very wrong indeed.
“My House Could Be Burning Right Now”: LA Menaced By Wildfires As 40,000 Ordered To Evacuate
Proof of Arson
What follows is a video of just one wildfire site in Northern California that was just arson-attacked by a fire-triggering DEW*. Below the video is a screenshot which shows the size of that conflagration relative to the California coastline.
*DEW = Directed Energy Weapon
MASSIVE EXPLOSION Strikes No. California 50 miles wide! (Video)

For a better frame of reference, the following map of Northern California indicates the area of this particular conflagration in Mendocino County (indicated above), which is west of Sacramento and just east of the coastline where it juts out into the Pacific.

Now here’s a close-up of the same explosive fire at the very beginning of the burning phase:

For the proper context of this screenshot frame, please watch this entire video before it’s taken down by YouTube: Infrared Camera Captures Strange Ignition of Massive Kincade CA Fire (Video)
Kincade, CA offers the kind of low-density population locale and type of terrain for wildland fires that the New World Order globalists are dead set on burning out and burning down, respectively. Here’s why:
Deracination
In this deliberate way, the real perps are terrorizing the residents with annual firestorms in order to forcefully move them off their ancestral lands, especially throughout the conservative red counties of California. However, there are also many blue county residents getting burned out as well during the last few years.
This ongoing series of clandestine black operations is all about purposeful and well-planned DERACINATION.
 Not only are the governmental and corporate co-conspirators committing a targeted genocide with these false flag attacks (“false flag” because they are incorrectly blamed on Mother Nature and PG&E), they are then stealing the coveted lands wherever, whenever and however they can.
The NWO globalists well know that nothing works so effectively than to scare the residents off their properties via a surreptitious implementation plan of deracination.
“California is using the “Firegeddon” meme to fear-monger,
and terrorize red county residents off their land. First they
predict the fires, then turn off the power, then start the fires,
next they spread the fires…. Yes, there’s much more to this
power shutdown, but that’s the gist of it.”
— Intelligence analyst & Former U.S Military Officer
Why else are they burning out so many folks up and down the state?
Because they want them to move out of the U.N. zones (See Agenda 21 link below).
So, while the goal of land theft is almost always the primary purpose behind terrorism throughout the world today, they also want those groups of people to move elsewhere just as they fast-tracked the Syrians right to Europe. They didn’t human traffic them to another Middle Eastern country, they cynically transplanted them to a totally foreign culture.
Just look at how the same NWO perpetrators have terrorized the Syrian people off their ancestral lands since 2011 just like they did with the Armenian Genocide 100 years earlier in the very same region.
Manufactured Wildfires
Now here’s how they do it!
Here’s how they first geoengineer the most conducive conditions in which to start the ‘wildfires’, and then widely proliferate them with a pyromaniac’s vengeance.
Atmospheric Aluminum via Chemtrails,
HAARP Frequencies,
Weaponized SMART Meters,
Specific EMFs Disseminated from
Cellphone and Microwave Towers,
Localized 5G EMP,
Directed Energy Weapons Fired from Drones,
Satellites, Air Force Aircraft, Naval Ships,
Arsonists Disguised as Firefighters,
Fire-starting Incendiary Devices,
Gross Mismanagement of California Forests,
Overloaded PG&E Power Lines,
and Other Geoengineering and
Weather Modification Techniques
Are All Used
in a Highly Coordinated Fashion
to Fabricate a Very Conducive
Environment for Isolated Firestorms
to be Triggered and then
Spread like Wildfire
in Targeted Communities
Throughout California
Statewide Crime Scene: “The Carefully Hidden Back Story”
There’s only one way to properly understand the sheer depth and breadth of this yearly scheduled crime wave. The two major elements of the true narrative include profound corporate criminality and pervasive government corruption. Both of these have quietly yet considerably contributed to this multi-decade crime spree of geo-terrorism.
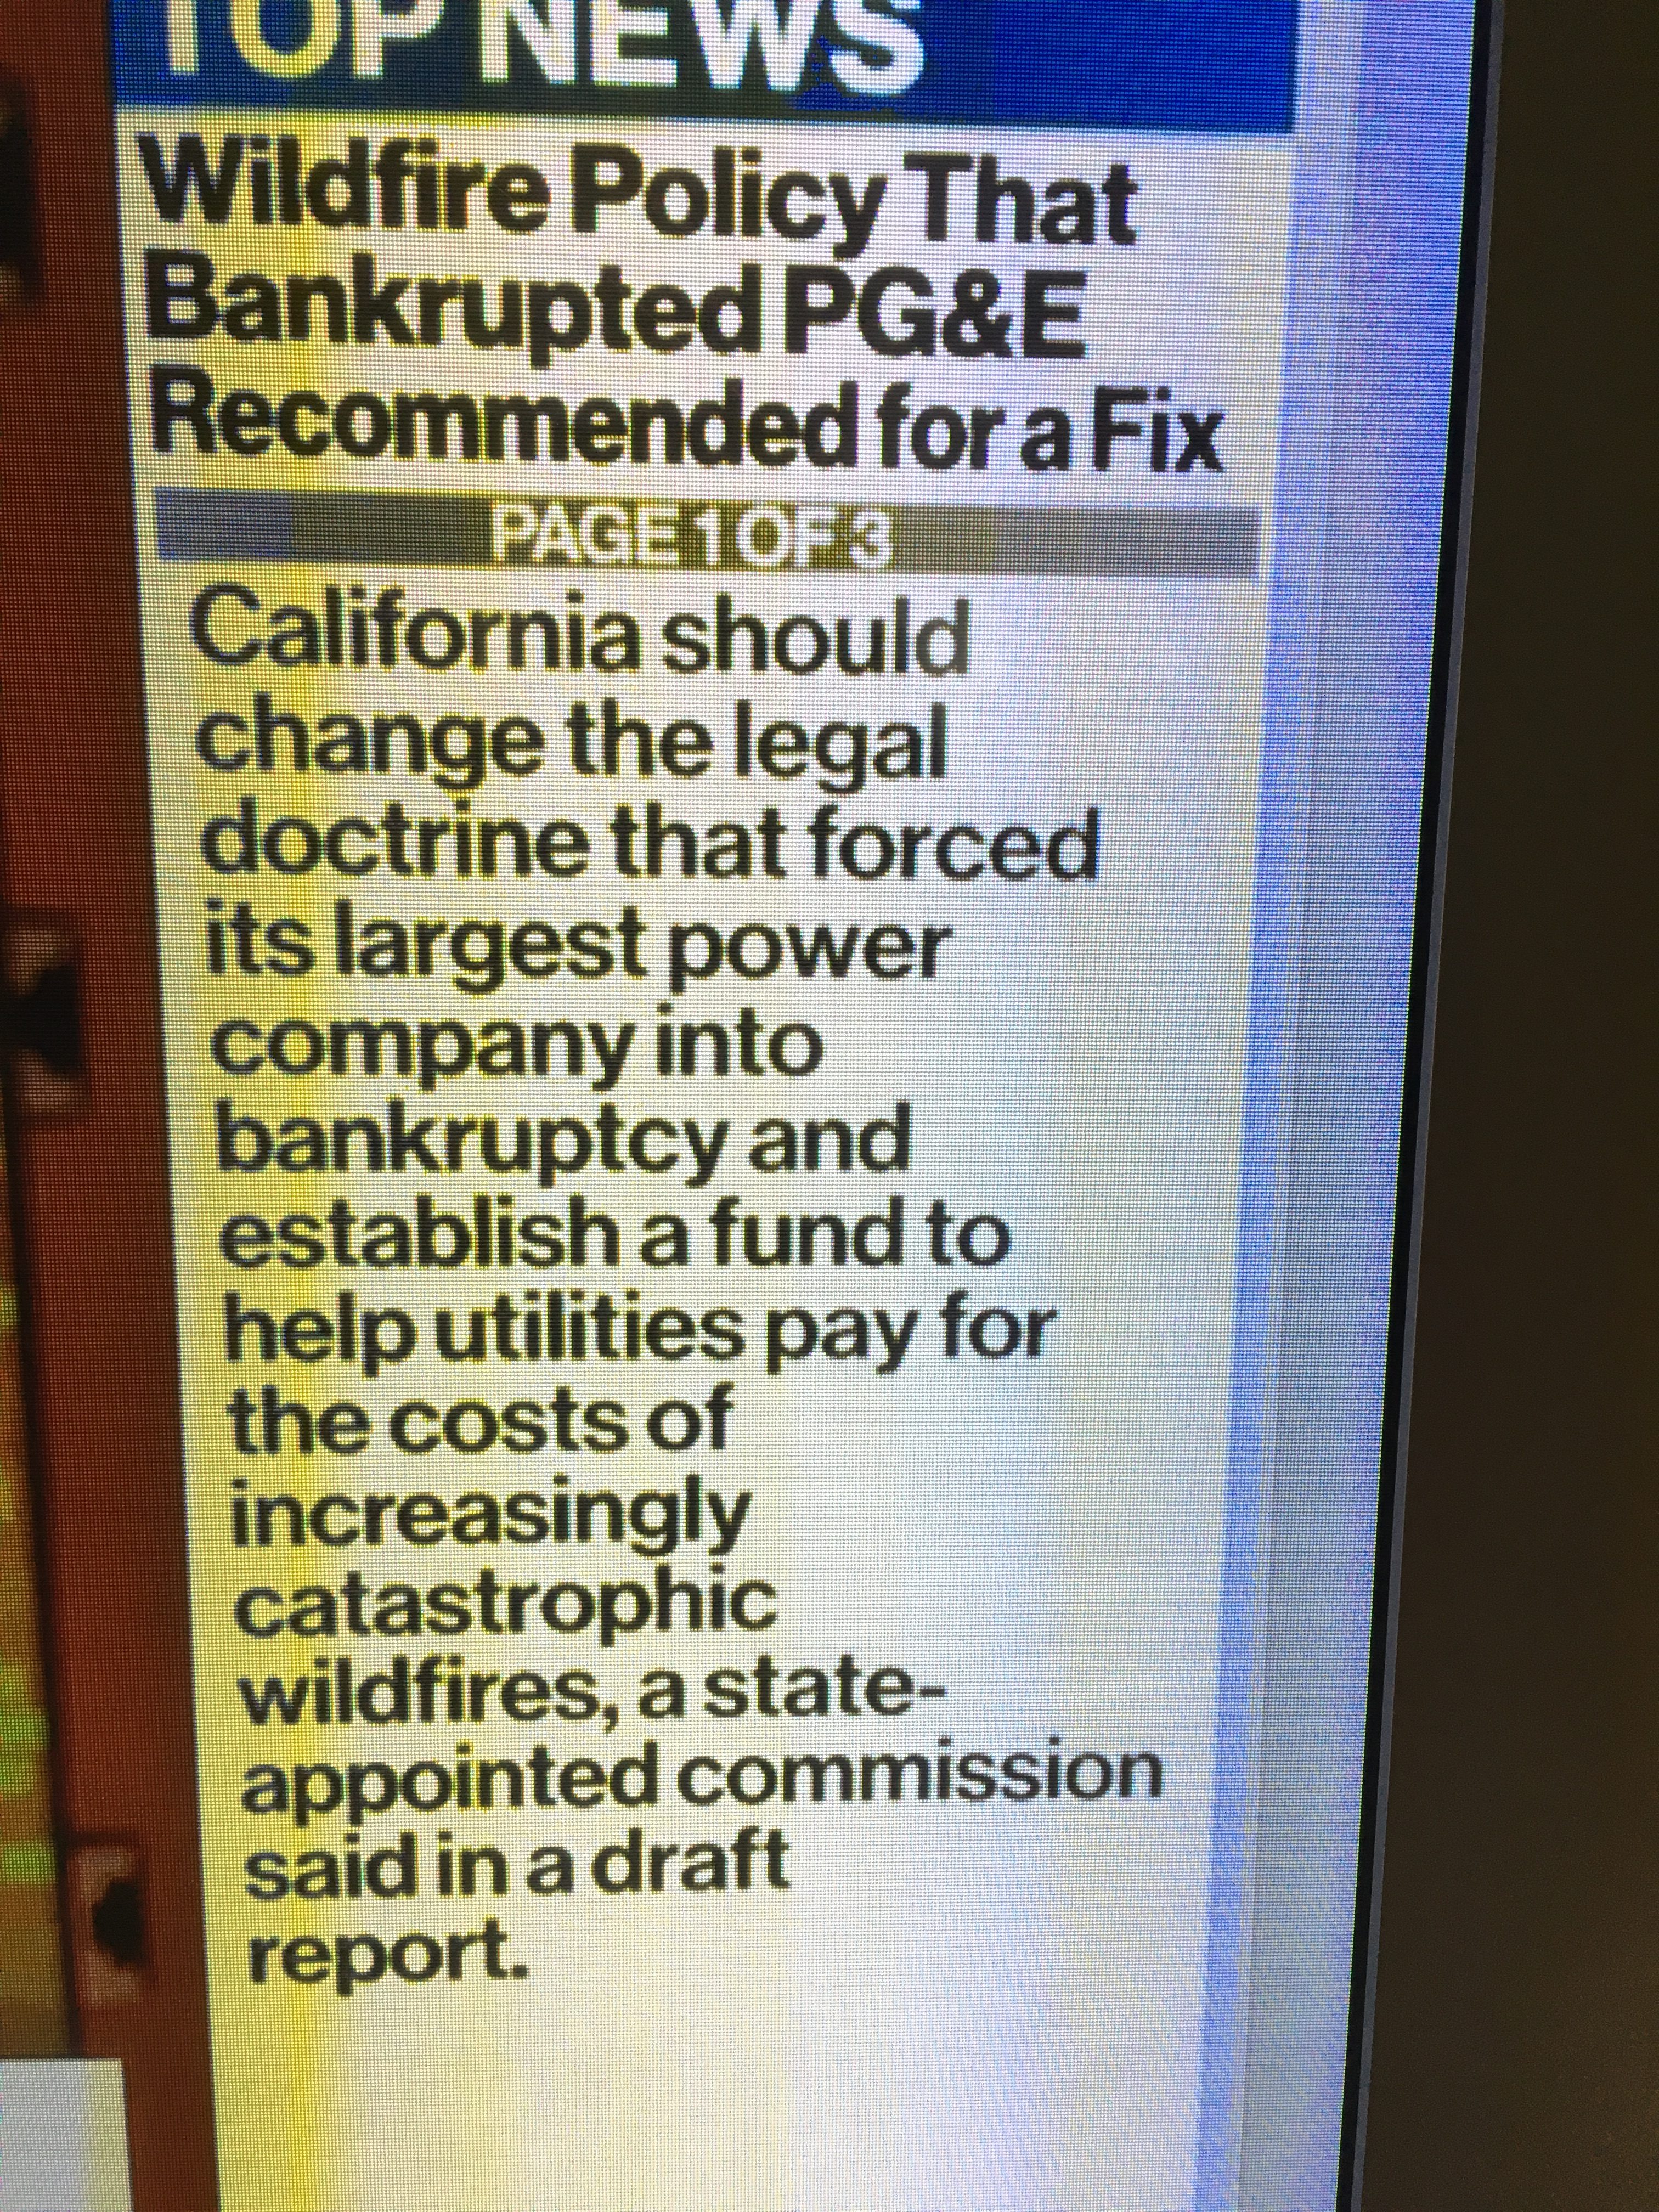
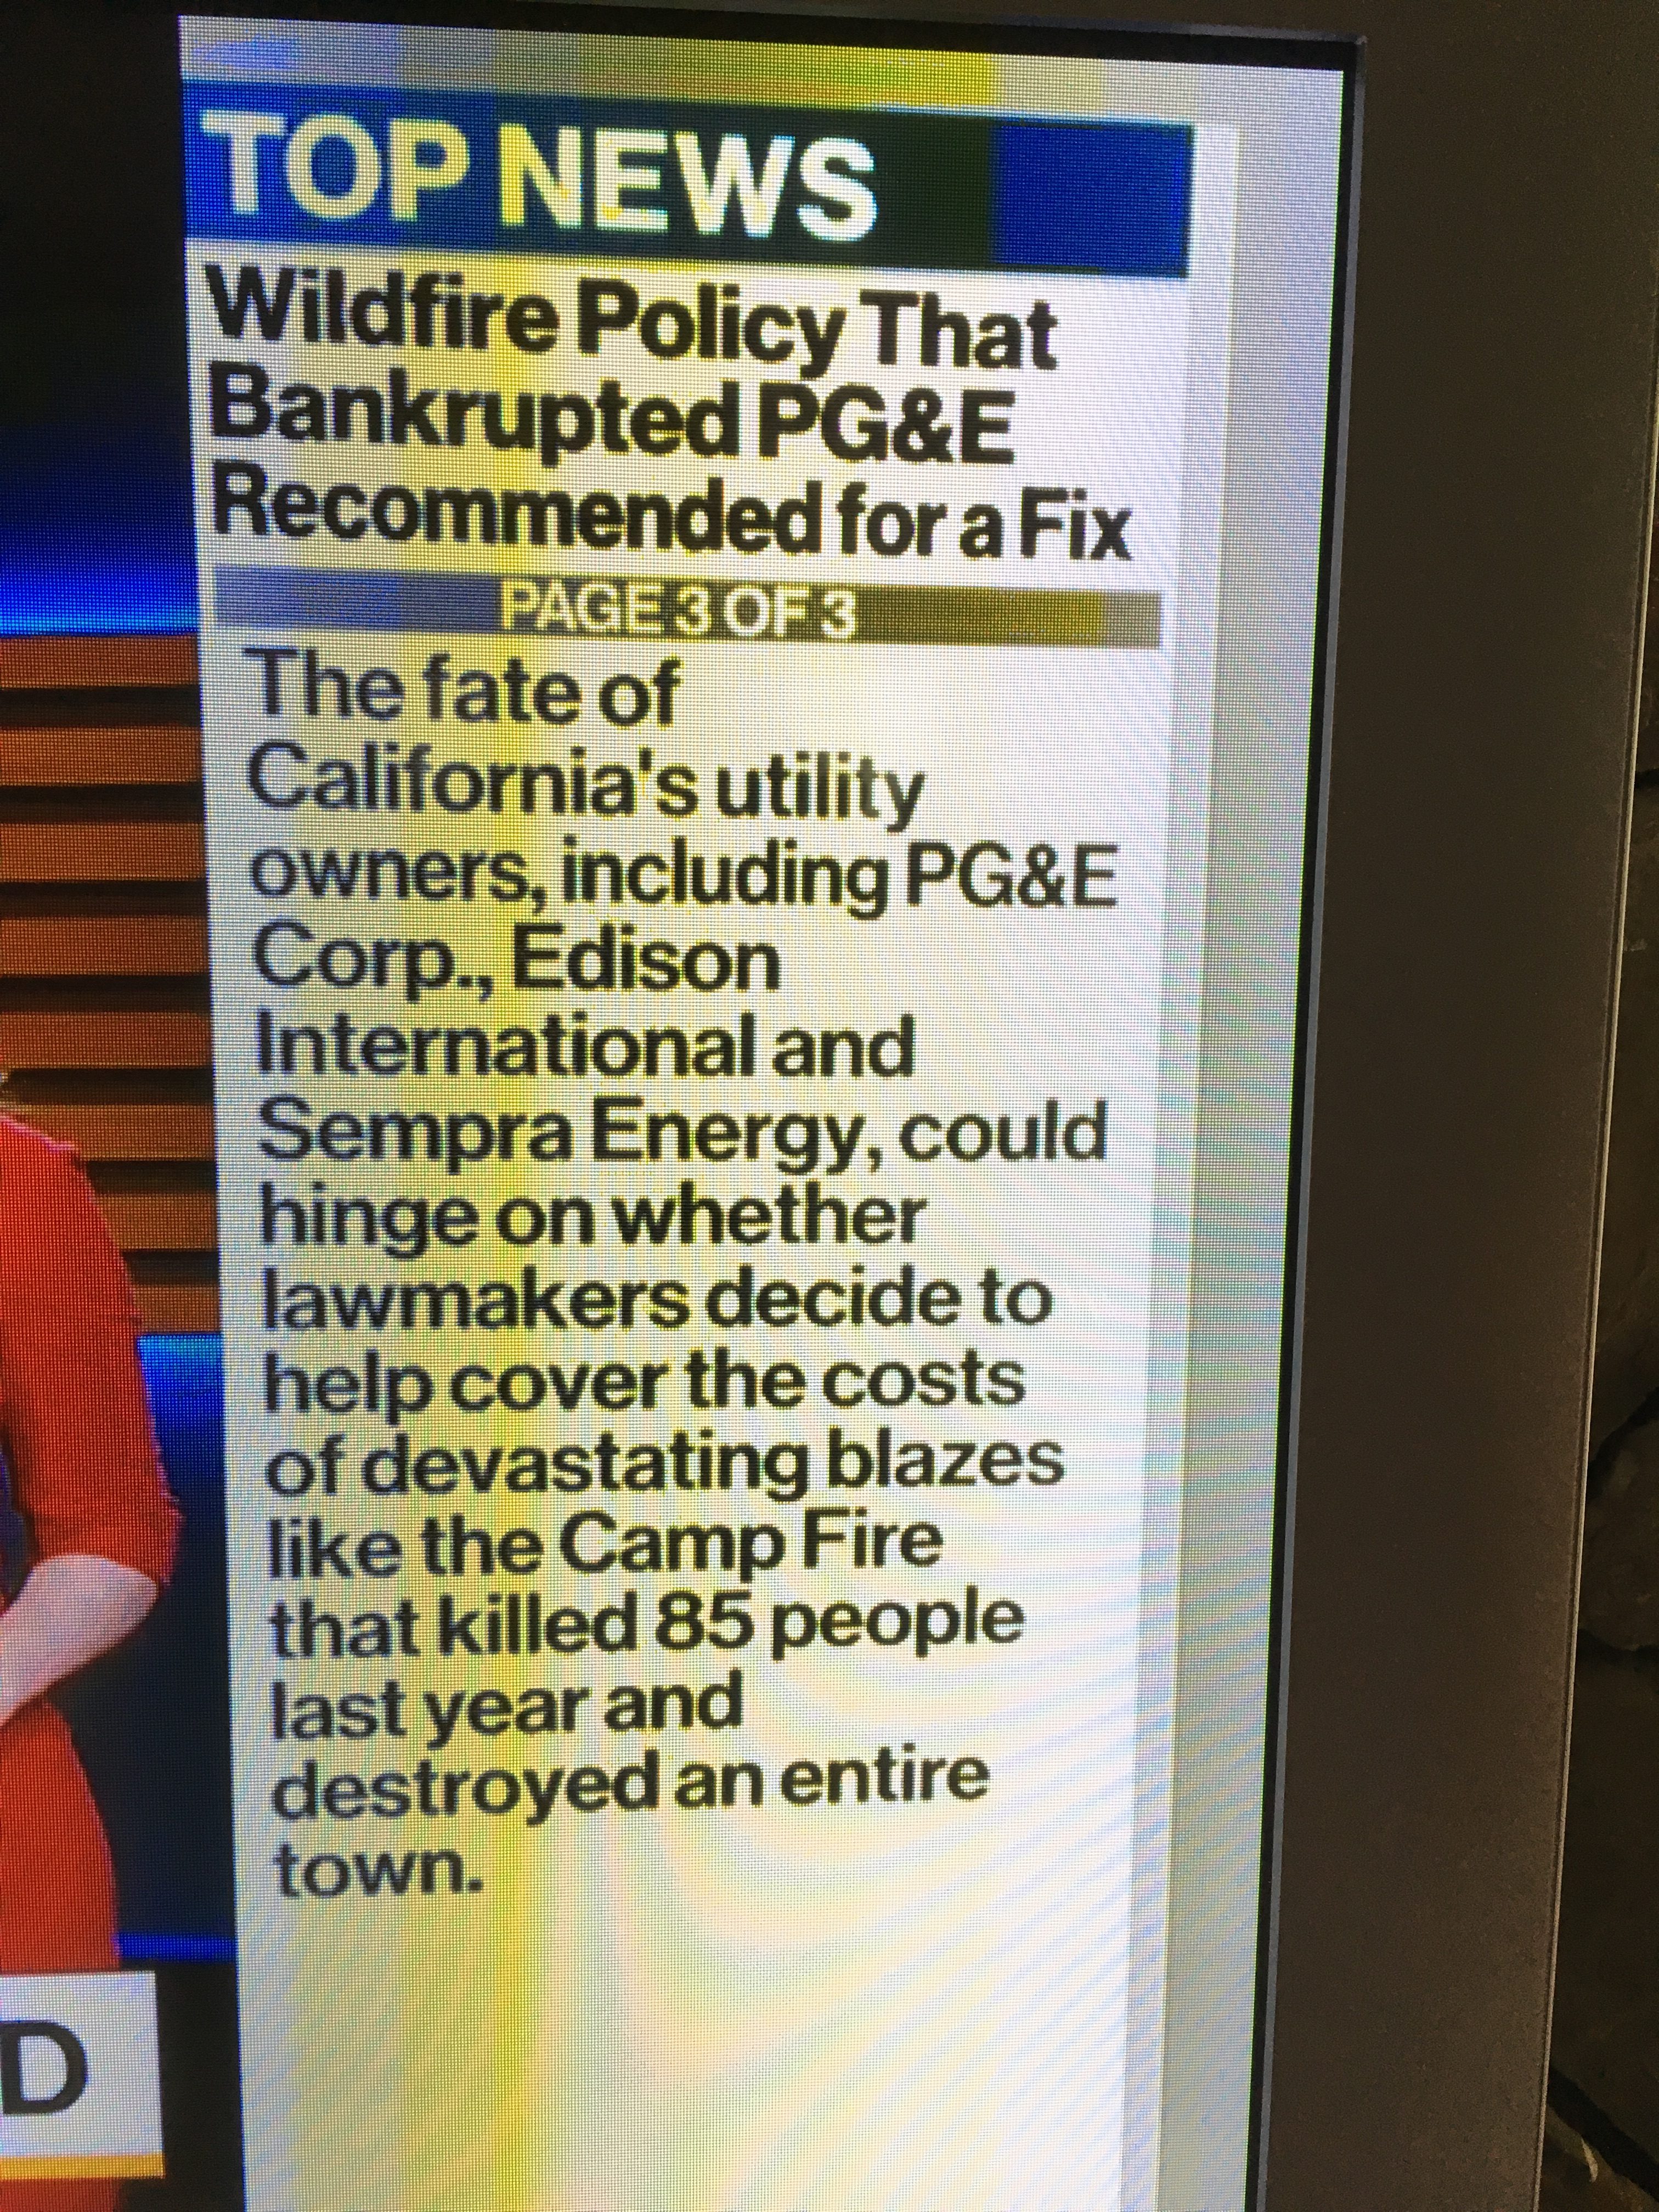
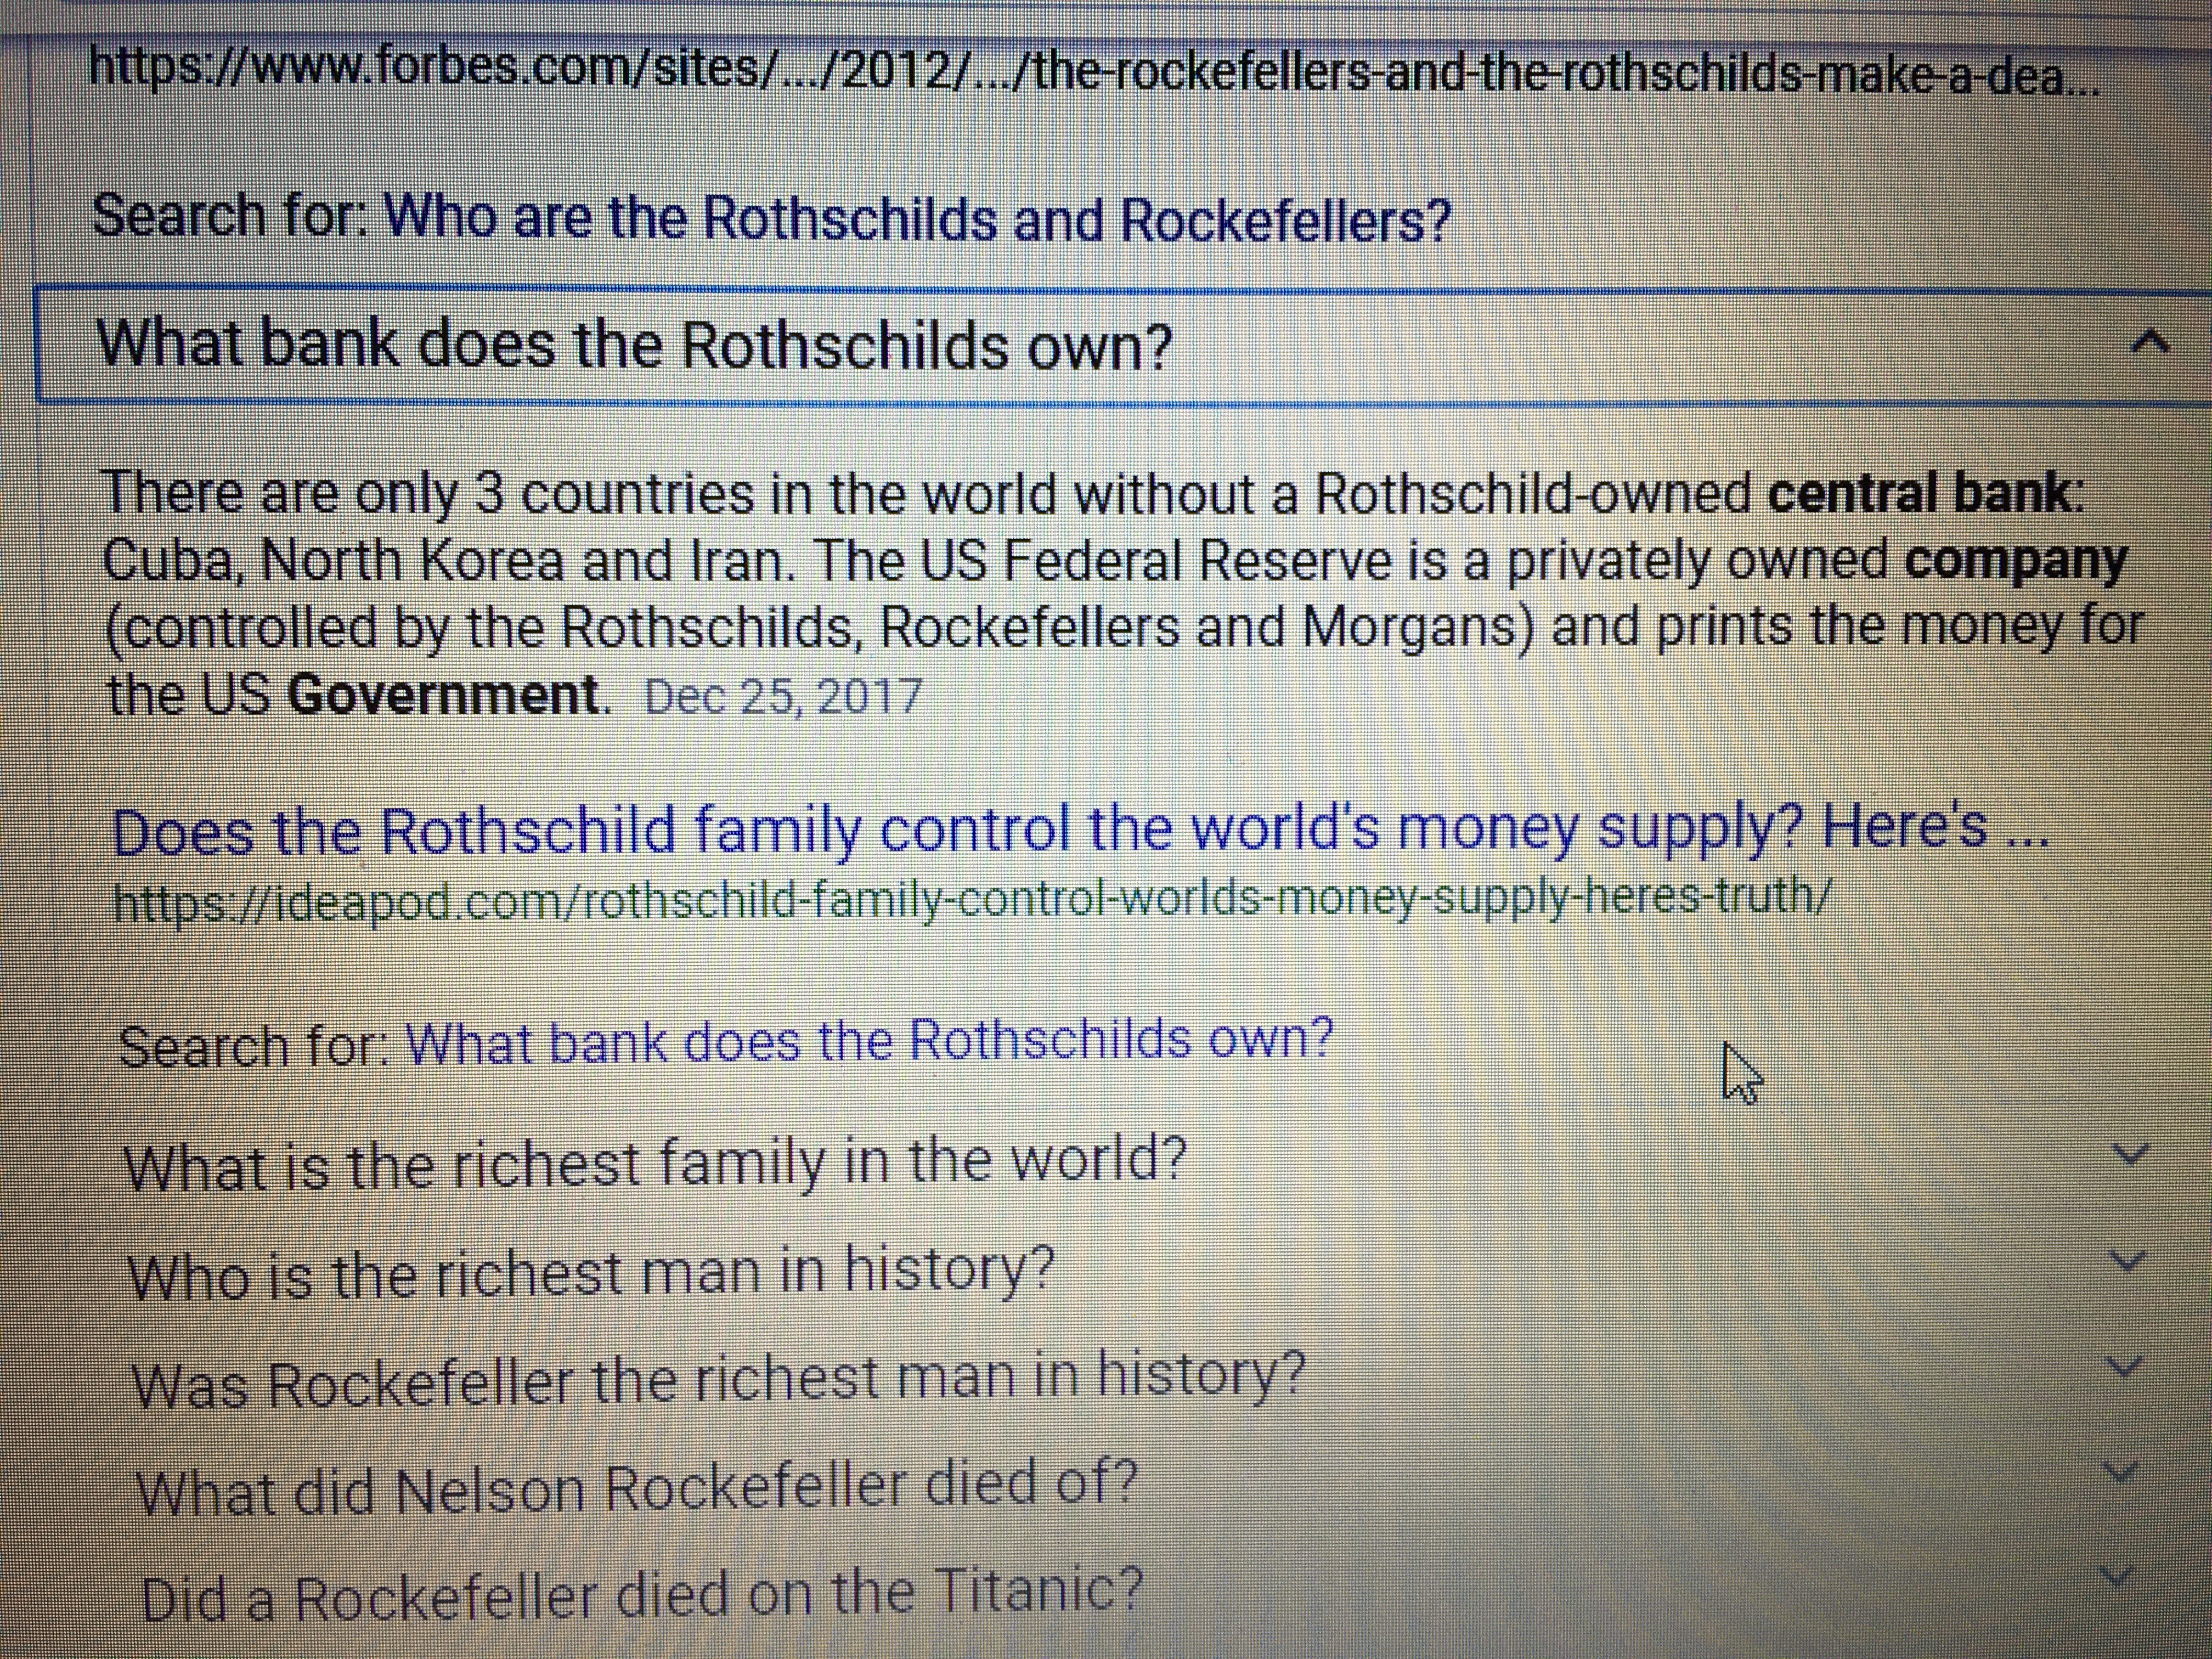
KEY POINT: PG&E is conveniently controlled by the Rothschild Banking Family. This arrangement permits that corporate crime syndicate to control the power generation capacity all over California. The Rothschilds then use the electrical grid to manipulate the energy markets, as well as utilize the power lines and transformers to trigger fires during the hot and windy seasons, which they have done like clockwork for years. Yes, PG&E may be bankrupted, but the Rothschild business and personal interests are always shielded from any losses. Their filed lawsuits will ensure that they are made whole as the Chapter 11 case below indicates. (See: PG&E board was controlled by Rothschild vice chairman until this year)

Let’s be very clear: Such a highly organized scheme to burn down the state of California could only be successfully carried out with the close collaboration of CA state government, the Military-Industrial Complex that has dominated the state for decades, Big Tech and Big Social Media throughout Silicon Valley, as well as Hollywood.
However, there’s also an overwhelming centripetal force at work that quite effectively holds all of these institutional co-conspirators together with great discipline.
The MOB
In point of fact, there are four interlocking crime syndicates outlined in the following video that exert the necessary muscle which keeps this massive conspiracy from breaking down. The same muscle maintains the cover-up in ways that would make the New York Mafia, Chicago Mob and New Orleans Cosa Nostra quite envious.
The 4 Interlocking California Crime Families (Video)
But how do these crime syndicates really do it?
They control the money … all the money … with exceedingly heavy-handed measures.
The only way to correctly grasp the degree of total lockdown on the financial side of this enormous black operation is to understand the microcosm of the Pelosi Crime Family. The following exposé delineates the main points which will inform how these crime families have co-opted all the key players in this ongoing conspiracy to terrorize the state and traumatize its residents.
COUP-IN-PROGRESS: Pelosi, the Mafia and the Black Nobility

The Other Back Story
There’s another almost inconceivable back story to this unrelenting scheme to burn out the people of California. The revelations presented in the link below offer an excellent introduction to the underlying purposes of OPERATION TORCH CALIFORNIA.
California Blackout, Martial Law and 3 Million Californians Targeted for Removal
For those who want to go even deeper down this rabbit hole, the following article gives bigger picture of the global crime scene as well as a peek into the real off-planet perps at the very top of the pyromaniac food chain.
CLIMATEgate: Climate Change Hoax, NWO Cabal and the Archons
Conclusion
What better way to force the people off their multi-generational family-owned lands than to furtively contrive a new normal of biannual power shutdowns?
Who in the world would tolerate the insufferable prospect of having their power shut off for days at a time — twice a year — and right in the middle of a full-blown disaster area when everyone needs their communication technology operating MORE THAN EVER? See: Here we go again: Power Shutdowns to Paralyze up to a Million of California Residents
If ever there was a mind-boggling psyop, OPERATION TORCH CALIFORNIA is it.
Not only does such an unprecedented show of force by the state and utilities incapacitate whole cities and counties and even larger areas, this unparalleled psyop sends a poignant and purposeful message: That the people are easily disempowered at will as they are rendered powerless at the flip of a switch. See: Deliberately Disempowering POWER SHUTOFFS the New Normal in California
With just a few more years of implementing these citizen-busting and land-grabbing policies, the mass migrations out of California are guaranteed to greatly increase just as the globalists intended as per Agenda 21 and 2030 Agenda for Sustainable Development.
Just where is this all going?
There are actually two answers.
While the globalists obviously have their nefarious NWO objectives, so, too, does the Higher Power have a divine plan. Truly, certain eventualities in California’s not-to-distant future ought to compel every resident to consider what that divine plan might be. Hence, readers, and especially the believers, are strongly encouraged to disseminate this post far and wide. The lives of many good folks, who are completely unaware of OPERATION TORCH CALIFORNIA, may depend on this highly censored information.

KEY POINT: Isn’t this just how they do it—Problem~Reaction~Solution? Not only are these arson fires a great advertisement for the Global Warming hoax, they will also help the globalists sell their fake Green New Deal. But first they always implement this type of Rothschild-sponsored disaster capitalism so they can generate immense revenue streams in the beginning, in the middle and at the end of these CIA-coordinated black ops. With headlines like these, they will certainly gain a LOT of traction for their climate change scam: California Faces “Biggest Blackout Ever” As 2.5 Million PG&E Customers May Have No Power For Days.
In closing, it must be pointed out that every once in a great while even the Mainstream Media will somehow get it right like they did with the following and similar headlines. Notice how often the MSM news reports have the word “explode” in their headlines this wildfire season. Since when do ‘wildfires’ literally explode with such power and convulsion unless they are actual explosions triggered by DEWs and the like?! Which means these massive ‘spontaneous combustions’ are purely manmade and designed to burn down the whole place. See: Fires explode across California, from wine country vineyards to Southern California subdivisions.
People, it’s time to take back the state before they really do burn down the biggest agricultural center in the USA. For once the communists morph it into Kalifornia, it’s technocratic control matrix will quickly spread to the other 49 states; the “Sultans of Silicon Valley” and “Hollywood Moguls” will see to that.
TARGETING and TORTURE gefoltert: How Haarp and surveillance technology really works
PG&E aka Rothschild – Burn’em Up and Fix’em Plan

Banks Owned by Rothschild and Rockefeller

NO MORE: Single Family Home Building in California – AB 68
BREAKING
NO MORE: Single Family Home Building in California – AB 68
Read more “NO MORE: Single Family Home Building in California – AB 68”
Coastal Commission blasts Del Mar for stance on sea level rise – Del Mar Times
NASA Engineer Discusses Satellite Weapons, Civilian Abuse And Military Technology Used On American Citizens
https://rense.com/general96/nasa-engineer-discusses-satellite-weapons-civilian-abuse.php
|
NASA Engineer Discusses Satellite Weapons, Civilian Abuse |
|
By John Richardson |
| Deeply informative and compelling discussion and disclosure with Richard Lighthouse, NASA engineer with degrees in science and engineering from Stanford University, as well as independent research in theoretical physics, who shares the current discoveries he has made from his research of patents and military programs, of USAF Space Command being putatively involved in the use since the 1980s of sophisticated Star Wars satellite weapons systems used secretly and without public knowledge in political monitoring, surveillance, and remote electromagnetic anti-personnel assault of civilians worldwide.
Sharing his discoveries of patents, and pointing viewers to information posted already at Technologies on TargetedJustice.com , a new human rights organization dedicated to exposing and addressing the criminal abuse of military technologies on civilians, Mr. Lighthouse delineates a timeline of weapon creation, patent recording and attribution (to the USAF), and subsequent seamless withdrawal of weapons into “classified” or “National Security” compartments, in tandem with public and documented reports of civilians reporting remote electromagnetic assault on their person from satellites, starting with well-known American citizen Harlan Girard. Given the wide reports of abusive electromagnetic anti-personnel technology use on civilians worldwide currently, Richard Lighthouse also discusses other weapons systems such as magnetrons used in conjunction with satellite GPS tracking and cell towers, smart meters, and portable weapons. Additionally, he addresses information emerging newly from perusing lawsuits and ACLU reports related to the FBI’s Known and Suspected Terrorist List program, which wrongfully lists innocent civilians to be considered “Non-Investigative Subjects” and coded “Silent Hit.” More on this subject may be found at Targeted Justice.com. https://www.youtube.com/watch? v=33O2J-oErOU&feature=share NASA Scientist Whisteblower ( Assange and Snowden are CIA rat traps… both say the government’s bullshit story was a “terrorist attack” and not what it was… a false flag attack done by the Zionist’s, Pentagon, CIA, FBI, NSA and deep state TRAITORS).
|


THIS IS NOT TRUE – England Town Bans 5G Rollout Amidst Growing Health Concerns England Town DID NOT Ban 5G Rollout Amidst Growing Health Concerns – Our towns – YOUR town has No Authority to stop the 5G “Deployment” PLEASE STOP BEING DUPED
THIS IS NOT TRUE – England Town Bans 5G Rollout Amidst Growing Health Concerns
England Town DID NOT Ban 5G Rollout Amidst Growing Health Concerns –
California State Sponsored ARSON – 5 Fires Ignited as PG&E Cuts Power.
Consistent with Agenda-21/2030 Media and “Authorities” are blame the fires on “people”.
Watch the California P-u-r-G & E Fires Begin in Real Time!!
https://www.bitchute.com/video/pH4xNwQqvik/?list=notifications&randomize=false