
CA2020_Plan_7-7-16_web_Part 3 of 5
Author: digigod
John W. Spring – DISINFORMATION ON KOREAN AIRLINES FLIGHT 007 IN PRINT.
Subject: DISINFORMATION ON KOREAN AIRLINES FLIGHT 007 IN PRINT.
Note: The below attachment on the Dade-Miami Aquifer, in spite of its author’s views on climate change, may be of some interest. It is published in the September 3, 2018 edition of Bloomberg Businessweek. JWS
Read more “John W. Spring – DISINFORMATION ON KOREAN AIRLINES FLIGHT 007 IN PRINT.”
WATER: Setting the Stage for Water Rates . . .


PORTLAND’s ZERO VISION PLANS . . .
This is a plan developed by Portlanders,
for Portlanders
Thank you to the Vision Zero Task Force and community members for helping to develop and shape this plan.
Legal Considerations
FREQUENCIES – FOIA Request PRA 18-187
Part 1 of 2From:City Clerk
Sent:Thursday, June 14, 2018 8:18 AM
Subject:PRA 18-187Attached please find the signed agreement with MobilitieFees CollectedMobilitieConceptual review fee for master license agreement: $2,000Encroachment permit Fees: application fees $384.00 (checks are not processed).VerizonEncroachment Permit Fees: total for all permits $30,847.00Building Permit Fees: $7,713.65Sandi Bliss, CMC| Administrative TechnicianCity Clerk’s Office|100 Santa Rosa Ave, Room 9 | Santa Rosa CA 95404Phone (707) 543-3007 | Fax (707) 543-3030 |sbliss@srcity.org
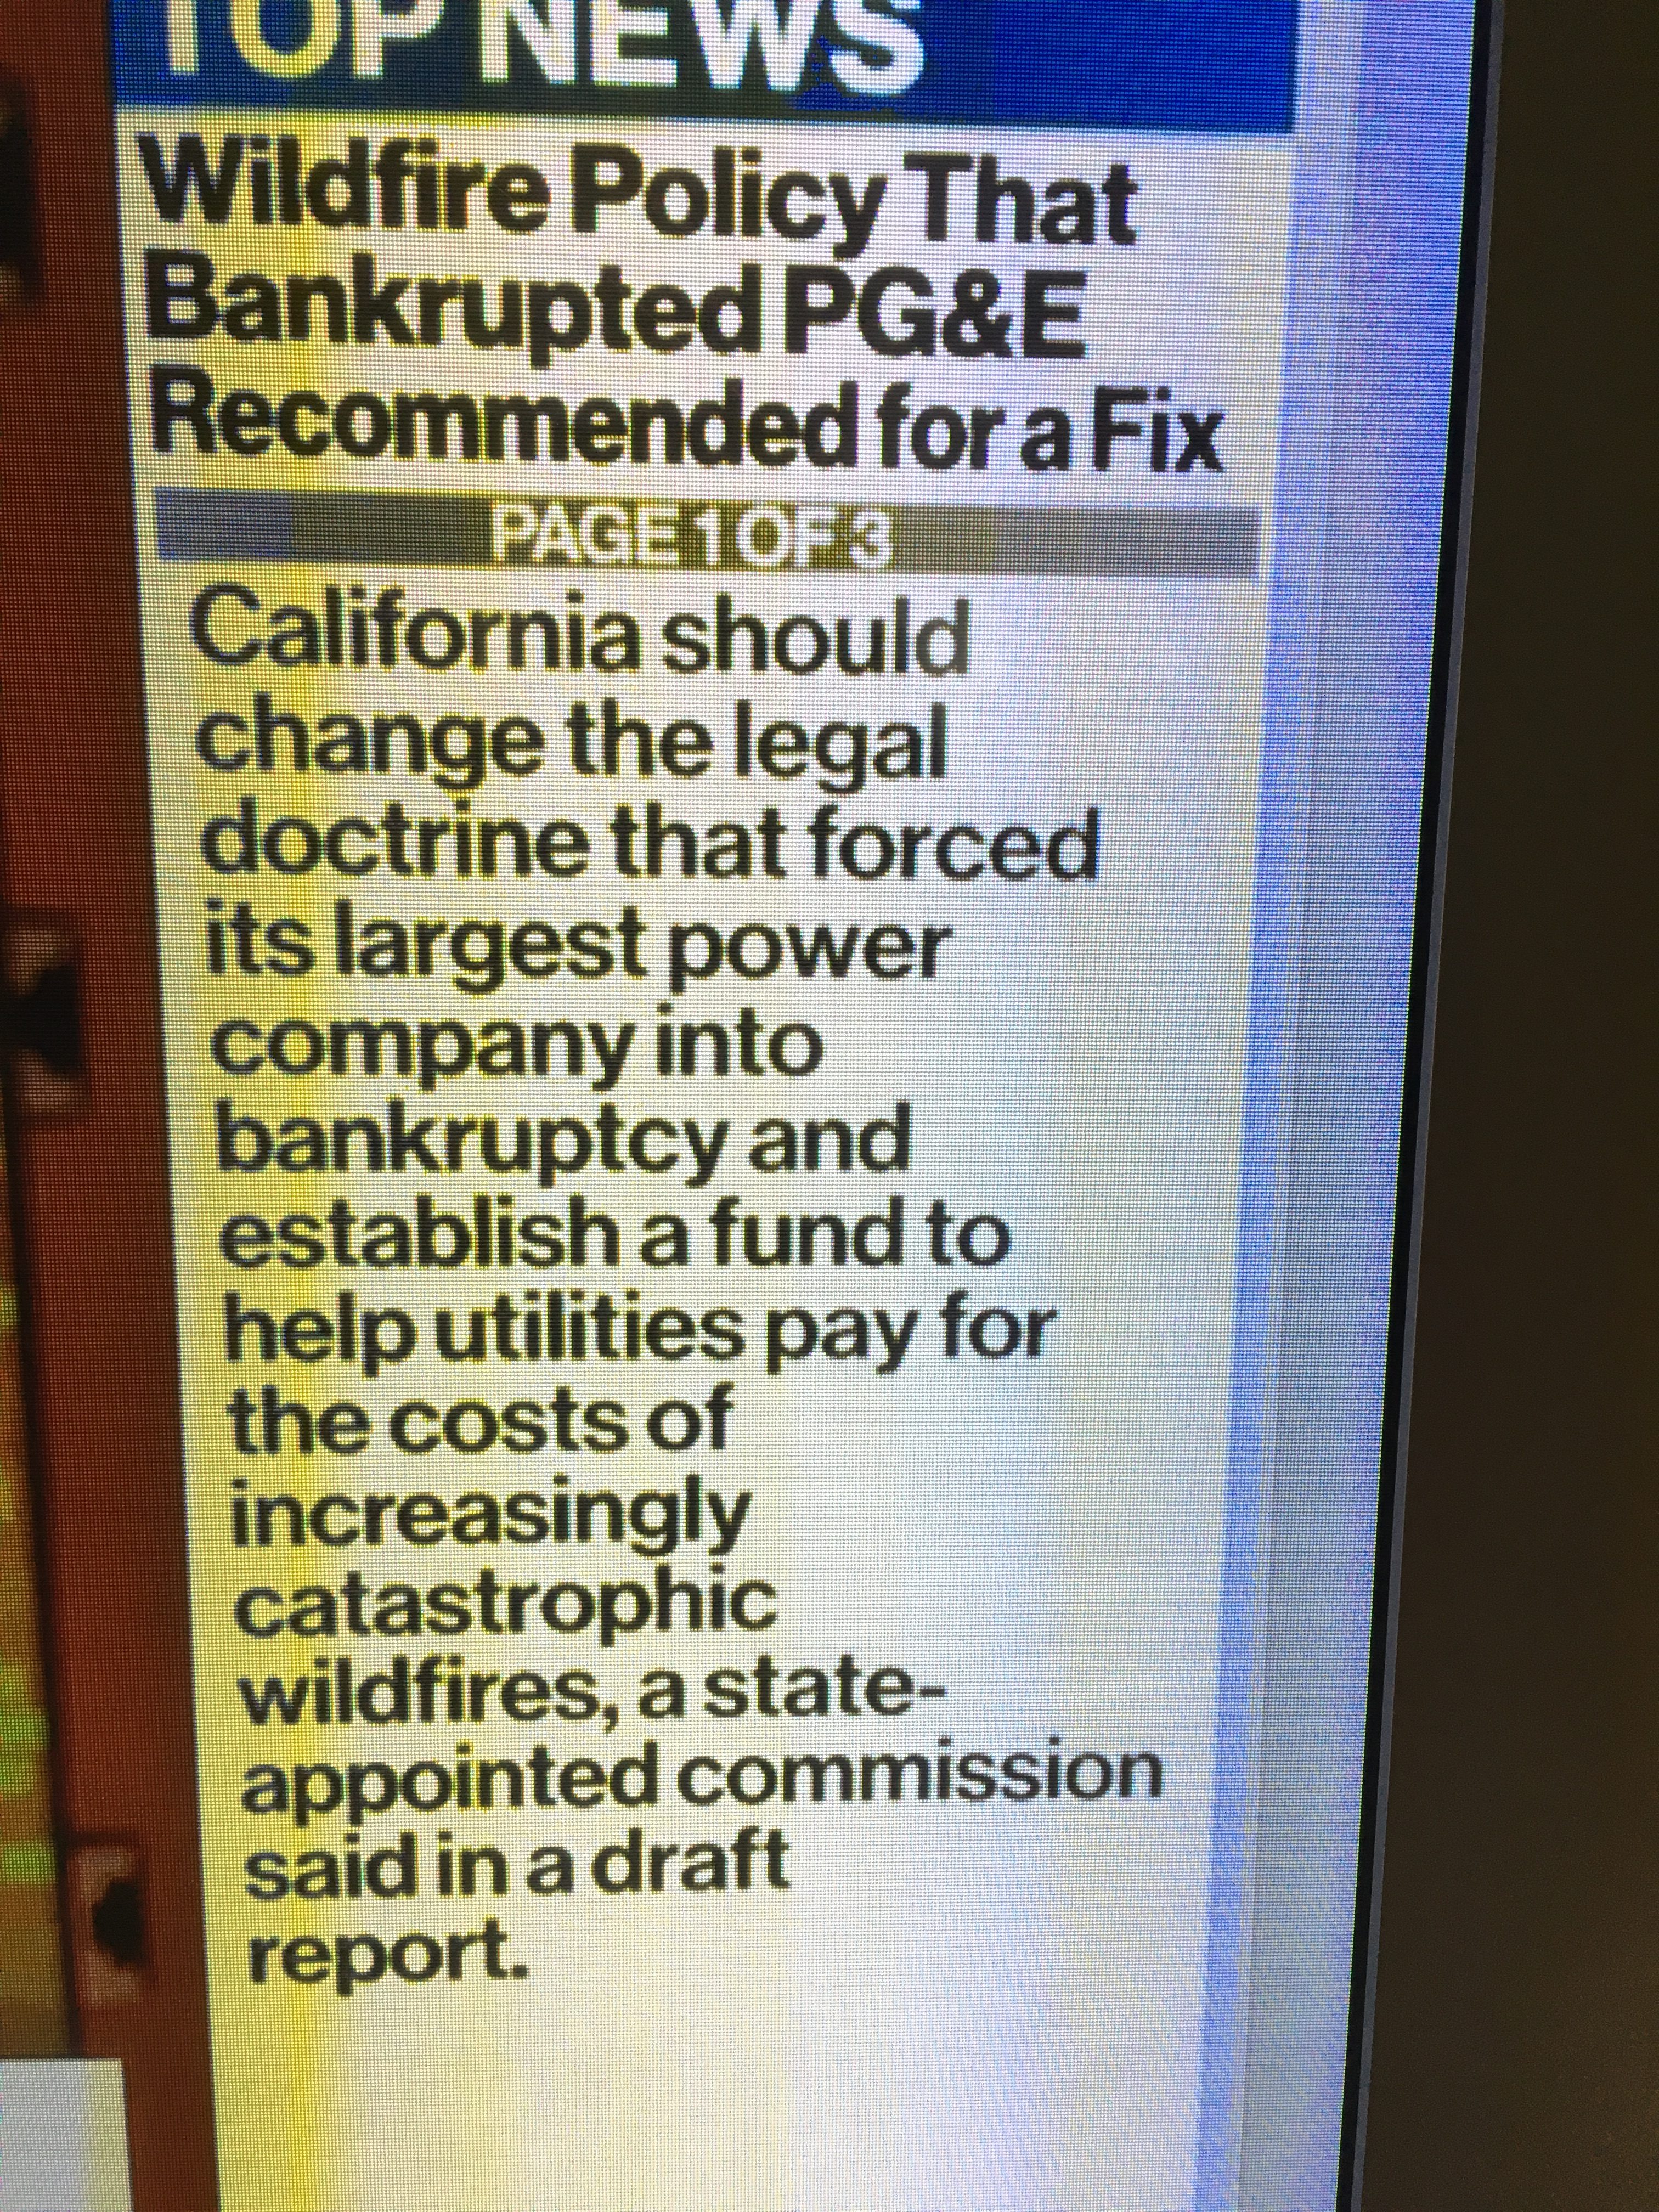
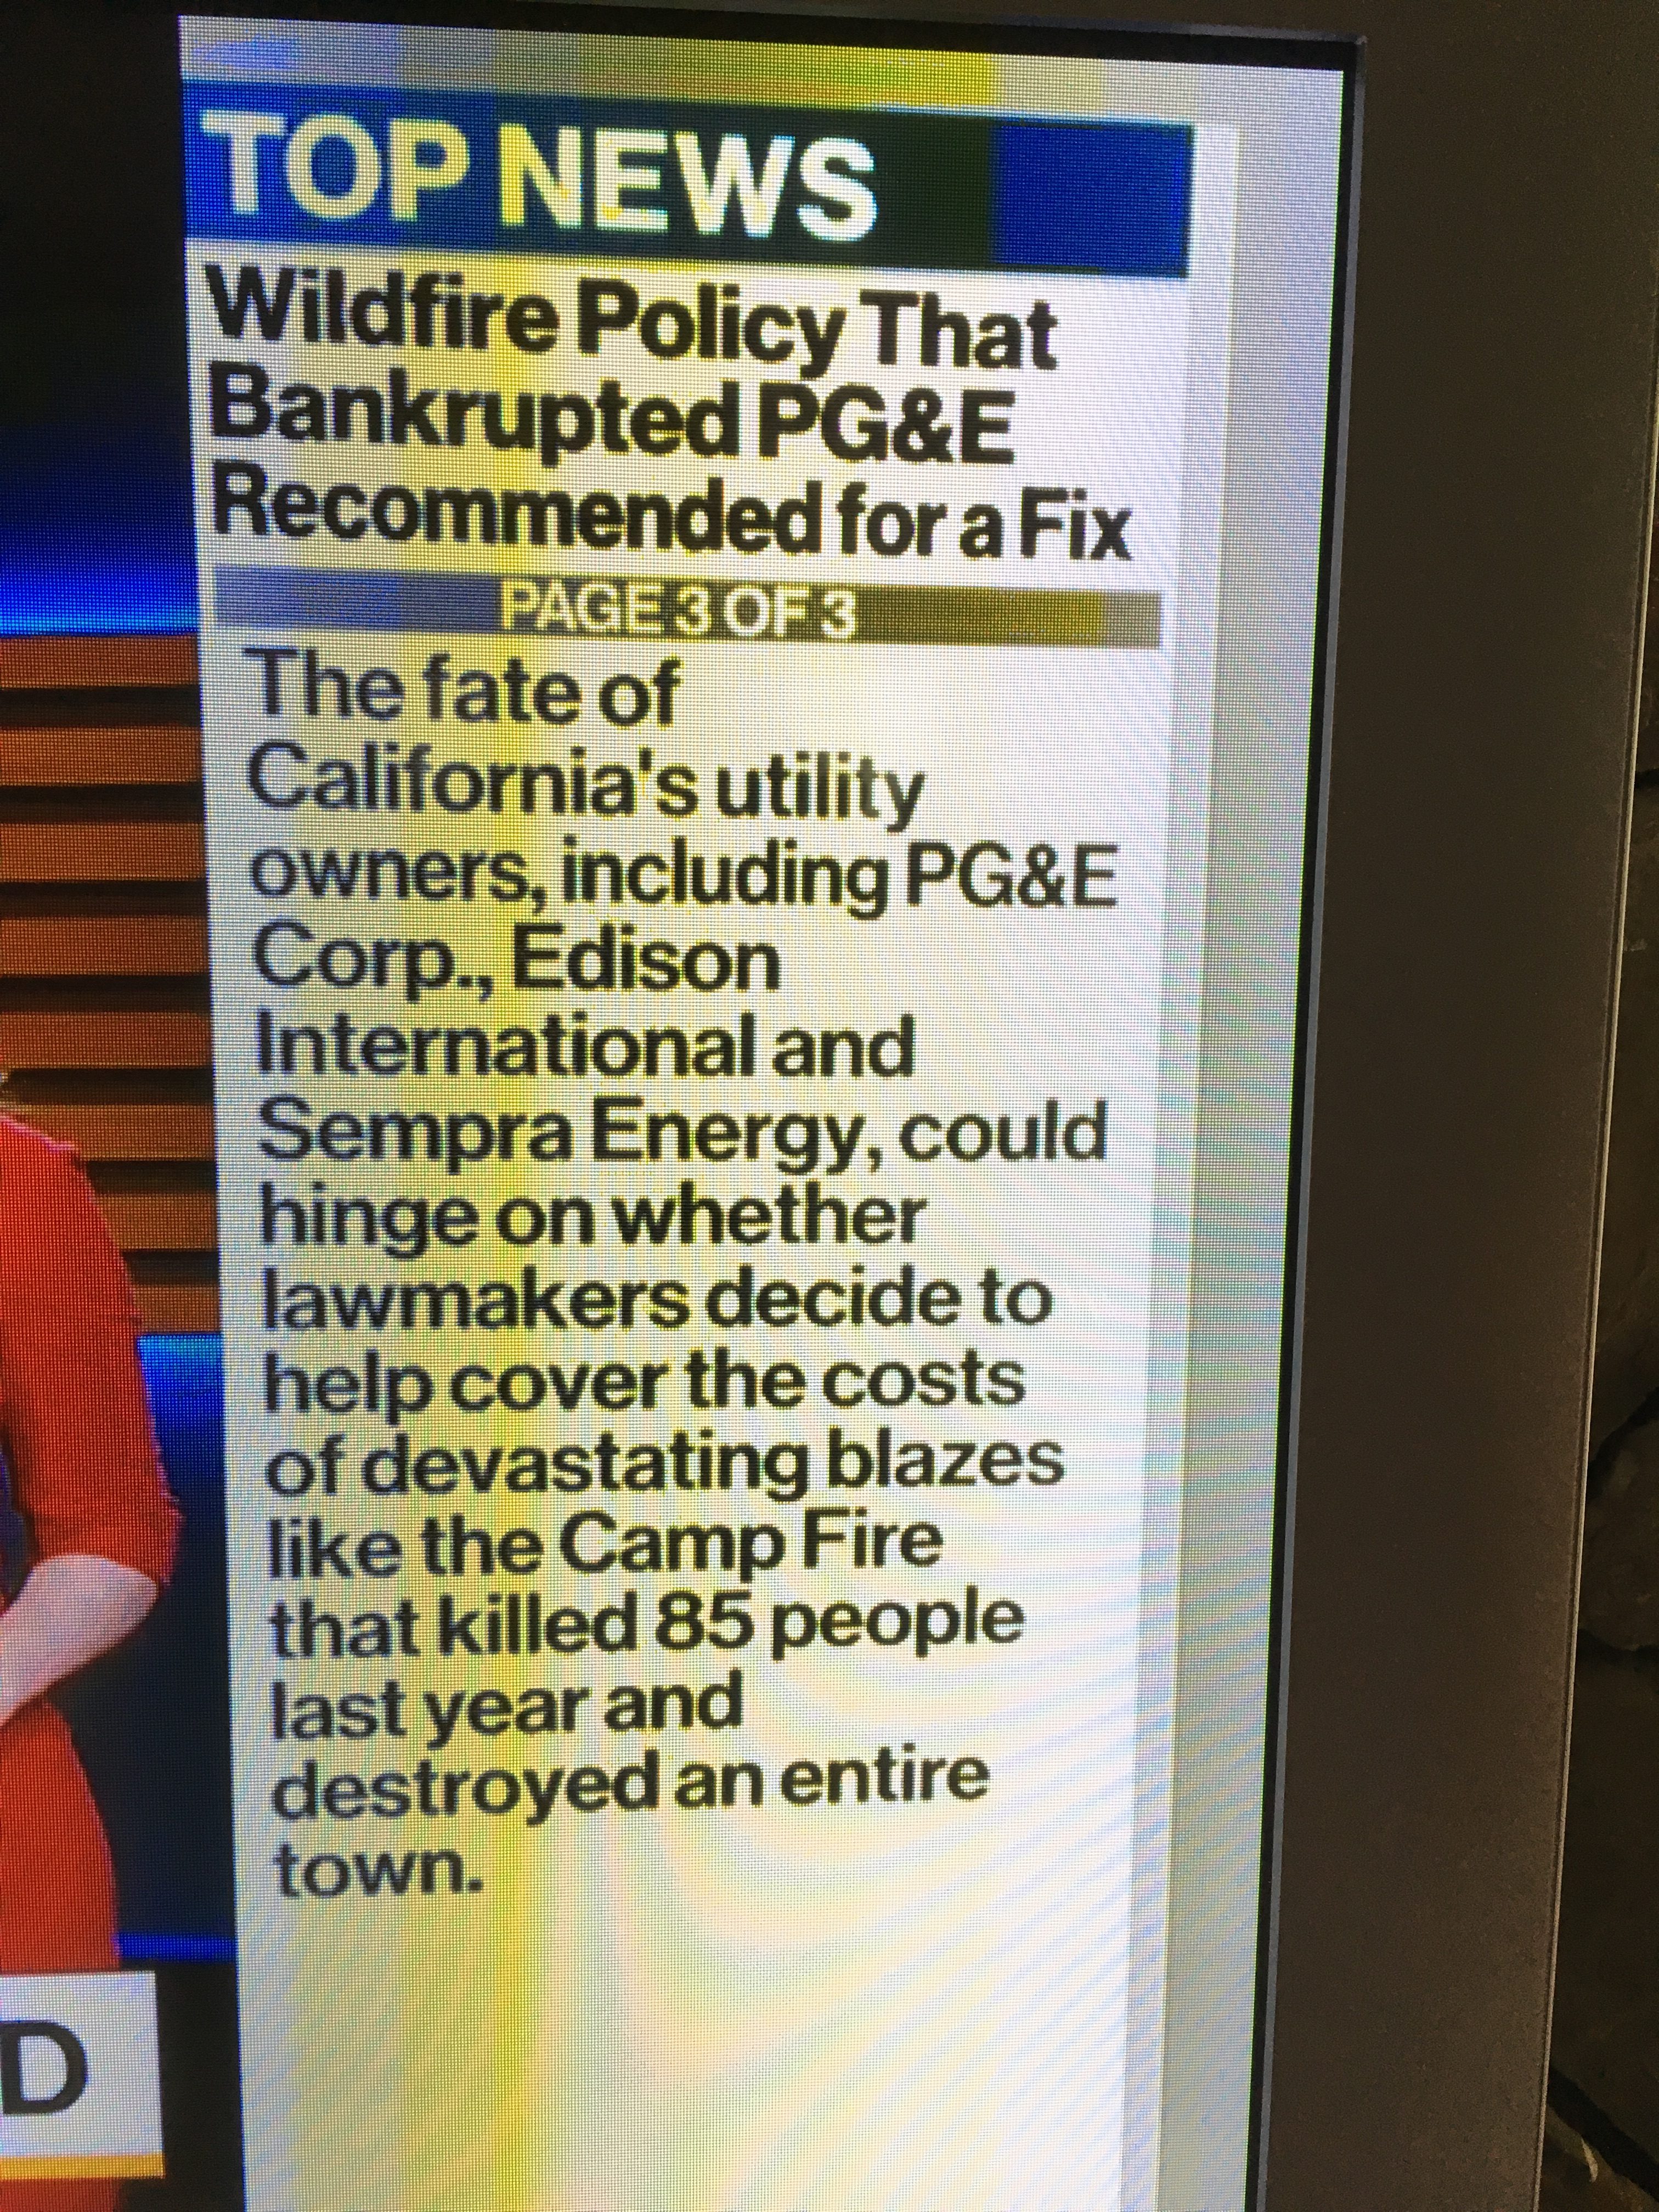
PG&E aka Rothschild – Burn’em Up and Fix’em Plan

Weather Weapons Targeting USA, Inc. Corn Belt


Sonoma County Climate Action PLAN – Public Request for Information
Banks Owned by Rothschild and Rockefeller


NO MORE: Single Family Home Building in California – AB 68
BREAKING
NO MORE: Single Family Home Building in California – AB 68
Read more “NO MORE: Single Family Home Building in California – AB 68”