|
Dr. John Gofman, Medical Director of the Livermore Nuclear Weapons Lab famously called that kind of thing “premeditated murder.”
This nuke stuff gets real serious, real quick. It’s a nasty, nasty business.
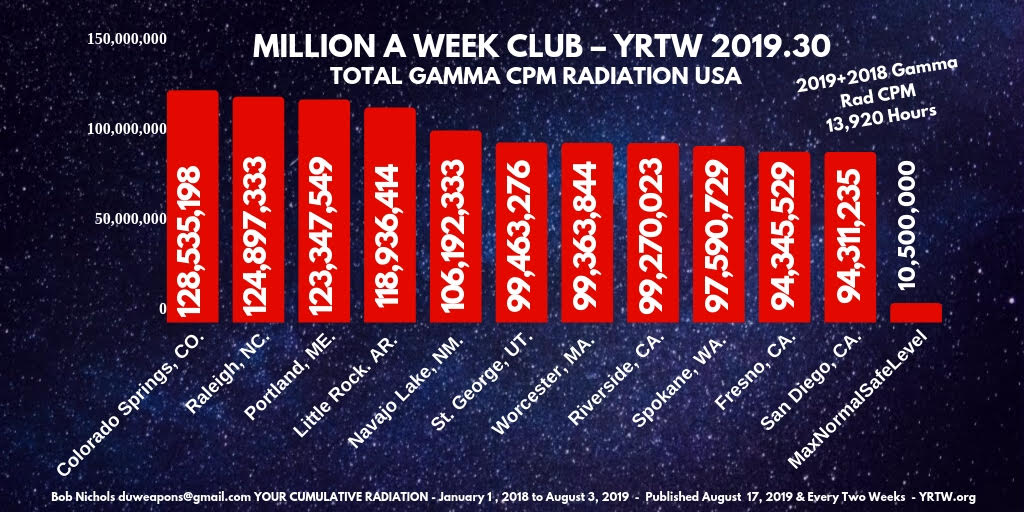
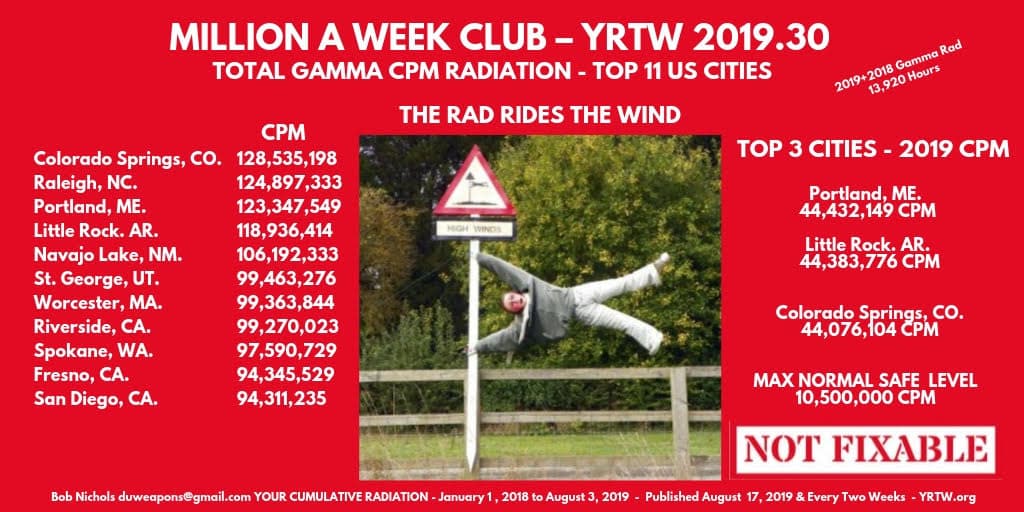
“This is a Bad situation for all who breathe,” states EU physicist Dr. Paolo Scampa.[5] Now included all cities above the MaxNormalSafeLevel [27] of deadly Gamma Radiation since the beginning of 2018.
Gamma “Rays” unpublished radioactive kin are a disastrous freebie from the PTB [Powers that Be.] A Count is One Radioactive Decay.
SHOWSTOPPER
Today’s 580-day or 13,920-hour report for January 1, 2018 to August 3, 2019, is another case of Bad news from your RadWeather Report.
I won’t try to kid you with good news lies and made up “fake facts.” Bottom-line, this is way too much radiation for humans to take.
I despise the people-like animals responsible for this worldwide calamity. I will continue the report as long as I am able.
Continue to read and share as long as you are able. Tell your smart friends; the others, not so much; they will not believe you. Above all, be selective.
The Perps knew exactly what they were doing and did it anyway. That’s textbook psychopathic behavior and a whole bucketload of Criminal Acts.
Denial is very strong in Americans; expect it often. Don’t let it get you down; there are millions of folks who know the score on the Rad. Persevere, Find Others. Figure out what to do.
I will measure and characterize our shared demise to the best of my ability. BookMark this article and Sign up for Emails on VeteransToday and my Websites; I’ll keep you advised.
Cell Killers
All cities with RadNet Total Gamma Radiation counters are above the Maximum Safe Gamma Radiation Level.
Their killer attack on your body’s trillions of cells never ceases. It did not used to be that way y’know – back in the day.
There were only four radioactive Isotopes then in existence and their Decay products. They were mostly in the ground.
Today there are 1,946 known radioactive Isotopes in existence in our atmosphere. The known Gamma radioactive Isotopes are measured by RadNet [1] and reported here.
Cell assassins, like Plutonium 239, and its brothers were never around; they did not exist on this Planet.
RadNet has largely stopped reporting radioactive Beta counts. No explanation was given.
What started the whole Rad Counting thing
No mystery there. DC got Zapped. RadNet measured and recorded 7.38 BILLION Beta Radiation Counts in Washington, DC[31] in 2006.
Only a few countries possessed that kind of nuke power for excursions; including the United States of America.
The Perps and/or corporation(s)/country or countries that caused the radiation excursion to occur never have been identified publicly. Speculation varies widely.
Who do you think did it?
Recorded by RadNet, it displayed the real radiation threat to life and limb.
RadNet measures and records Raw Total Gamma Radiation in Counts per Minute and nSv/Hour. Beta Counts are measured and recorded on various occasions.
RadNet started publishing radiation data in 2006. I suspect strongly the nine Nuclear Weapons Labs collected the radiation data for years before 2006.
To date, the Radiation Counts before 2006 are not released to the public.
Max Normal Safe Level
The United States is a very radioactive country now. No cities are below the MaxNormalSafeLevel; all cities are above safe level. This includes cities and towns not on the list.
The raw records of Total Gamma Radiation are easily accessible with a computer and a fast Internet connection at RadNet, a directorate of the EPA. [1]
RadNet simply presents the raw Total Gamma Radiation data. I process the raw data to a useable form.
Use a fast InterNet connection or run the look-ups as a background task. Either way, you get the data yourself.
Good luck on your efforts. As they say, “It’s complicated.”
Conclusion. The amount of Rad in the air now Dooms Humanity to a relatively quick Extinction.
Have a wonderful radioactive weekend and remember to Dodge the Rads, it’s dangerous out there.
Resources*
Total Gamma Radiation Colorado Springs 2006 thru 2018: 911,206,330 CPM.
2018 Annual Rad CPM: 84,459,093 CPM Total Gamma Count, Beta Withheld
2017 Annual Rad CPM: 84,495,556 CPM Total Gamma Count, Beta Withheld
2016 Annual Rad CPM: 85,154,664 CPM Total Gamma Count, Beta Withheld
2015 Annual Rad CPM: 81,746,223 CPM Total Gamma Count, Beta Withheld
2014 Annual Rad CPM: 77,531,924 CPM Total Gamma Count, Beta Withheld
2013 Annual Rad CPM: 84,817,423 CPM Total Gamma Count, Beta Withheld
2012 Annual Rad CPM: 85,323,100 CPM Total Gamma Count, Beta Withheld
2011 Annual Rad CPM: 78,015,071 CPM Total Gamma Count, Beta Count: 568,266 CPM
2010 Annual Rad CPM: 76,610,646 CPM Total Gamma Count, Beta Count: 598,878 CPM
2009 Annual Rad CPM: 79,872,468 CPM Total Gamma Count, Beta Count: 1,278,274 CPM
2008 Annual Rad CPM: 93,502,028 CPM Total Gamma Count, Beta Count: 2,183,901 CPM
2007 Rad CPM: Zero, Radiation Count Data Not Available to the Public.
2006 Rad CPM: Zero, Radiation Count Data Not Available to the Public.
Total Gamma Radiation Portland, Maine 2006 thru 2018: 589,690,089 CPM.
2018 Annual Rad CPM: 78,925,336 CPM Total Gamma Count.
2017 Annual Rad CPM: 70,951,759 CPM Total Gamma Count.
2016 Annual Rad CPM: 25,288,835 CPM Total Gamma Count.
2015 Annual Rad CPM: 69,080,020 CPM Total Gamma Count.
2014 Annual Rad CPM: 70,562,301 CPM Total Gamma Count.
2013 Annual Rad CPM: 69,063,736 CPM Total Gamma Count.
2012 Annual Rad CPM: 71,094,256 CPM Total Gamma Count.
2011 Annual Rad CPM: 69,292,457 CPM Total Gamma Count.
2010 Annual Rad CPM: 72,303,622 CPM Total Gamma Count.
2009 Annual Rad CPM: 62,191,503 CPM Total Gamma Count.
2008 Rad CPM: Zero, Radiation Count Data Not Available to the Public.
2007 Rad CPM: Zero, Radiation Count Data Not Available to the Public.
2006 Rad CPM: Zero, Radiation Count Data Not Available to the Public. |